Changelog D3.js Visual
Of the D3.js Visual for Power BI the following versions are released with the following new features, changes and bug fixes.
Custom Visual Validation Process
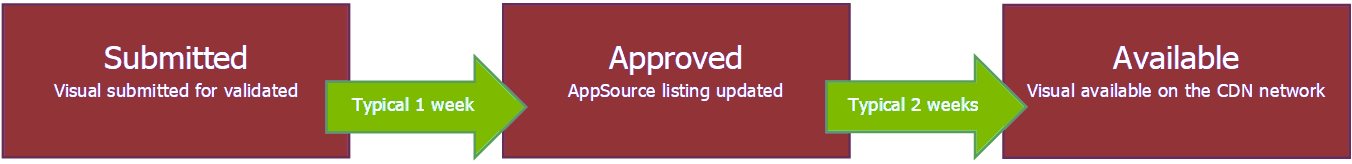 NOTE: All Power BI gallery visuals are distributed via the Azure CDN network and this will cause a delay of max a couple of days in delivering a new version.
1.1.0 – (13 December 2017)
NEW
- Support for optional
accessorfunction forpbi.dsv - Added
pbi objectfor look at the raw data
CHANGED
- SVG element dimensions are set at initial load
- Update to API v1.9.0
FIXED
- Fieldnames with spaces do not working
- Help URL not working
- Editor not working in IE11
1.0.0 – (Pre release version)
Initial release
Feedback
If you have any comment related to the documentation, like corrections, unclear features or missing documentation, feel free to leave feedback below via GitHub. Or correct it yourself and submit a PR; see CONTRIBUTING.md for more details. GitHub account required.