Power BI Event Viewer
Event Viewer
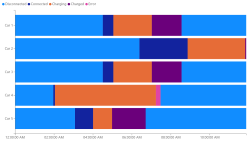 The Event Viewer chart visualizes device events over time. Ideal for IoT devices that report new states
Example
See here for an example if the embedded version is not working.
Data Fields
The Event Viewer chart needs data it a specific way.
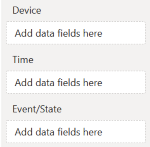 Devices - Field that contain the different devices that have state changes.
- Time - Time values used for the time axis.
- Event/State - The state value/string reported by the device(s). This field will be aggregated using the 'First' aggregation.
Important
The visual aggregates events per device and timestamp; by sure that the datasets contains a maximum of one event per timestamp per device. E.g. if there are multiple events per second, the visual will only visualize one event and the rest of the events is ignored.
Legend
With the legend option the behavior of the legend can be changed
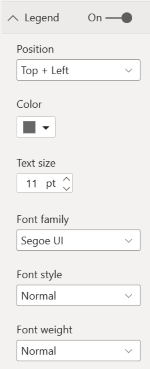 On - Turn the legend on or off
- Position - Alter the position of the legend: either top, of bottom in combination with left, right, and center
- Font Color - Font color used for the legend
- Text size - Text size used for the legend
- Font Family - Font Family used by the legend
- Font Style - Font Family used by the legend. Options are: Normal and Italic
- Font Weight - Font Weight used by the legend. Options are: Light, Normal,Semi Boldand Bold
Device axis
With the device axis option the behavior of the device (vertical) axis can be changed
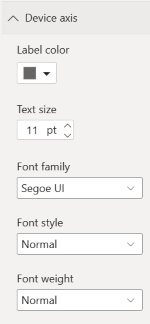 Label Color - Font color used for the labels
- Text size - Text size used for the labels
- Font Family - Font Family used by the labels
- Font Style - Font Family used by the labels. Options are: Normal and Italic
- Font Weight - Font Weight used by the labels. Options are: Light, Normal,Semi Boldand Bold
Time axis
With the time axis option the behavior of the time (horzontal) axis can be changed
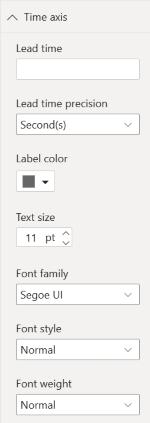 Lead time - Amount of time in used to 'ignore' before start the axis
- Lead time precision - Precicion used for the lead time: seconds, minutes, or hours
- Label Color - Font color used for the labels
- Text size - Text size used for the labels
- Font Family - Font Family used by the labels
- Font Style - Font Family used by the labels. Options are: Normal and Italic
- Font Weight - Font Weight used by the labels. Options are: Light, Normal,Semi Boldand Bold
State color
With the state color option it is possible to alter the colors of the different states. States are populated based on the data provided to the visual
- Persist formatting - Toggle to store current state color config. Toggle will be disabled after storing the color config.
- Colors - JSON Array with prefix link colors: [{name, color}]: use to set the different state colors to the provided one.
Unknown
With the unknown formatting option it is possible to alter the 'unknown' state. The unknown state can be used is the first event of a device is arriving late compared to the start time of the axis.
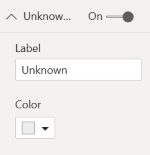 On - Turn the unnown state on or off
- Label - The text being used as the 'unknwon' state. Default:
unknown
Changelog
See for the list of changes here.
Feedback
If you have any comment related to the documentation, like corrections, unclear features or missing documentation, feel free to leave feedback below via GitHub. Or correct it yourself and submit a PR; see CONTRIBUTING.md for more details. GitHub account required.