Power BI Custom Visuals
 Overview of my Power BI custom visuals available in AppSource.
General
- Privacy terms
- Explanation of Power BI and Azure CDN
- Visual Studio Code extension for easy development
Box and Whisker chart
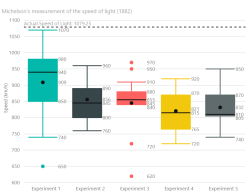
 Visualize a dataset as a box and whisker chart. A box and whisker chart shows basic statistical information of a dataset: the 1st and 3rd quartile (box), the median (line), the mean (dot) and dependent of the type either the minimum and maximum value of all values or between the 1.5x interquartile range [IQR] (whiskers).
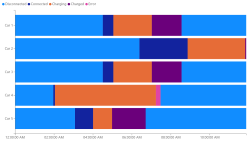
Event Viewer
 .
.
Hierarchy Slicer
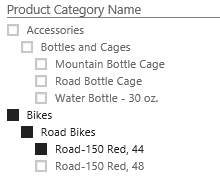
 With the hierarchy slicer it is possible to represent a hierarchy as a single slicer. The different levels are shown as a tree.
D3.js Visual
 The D3.js Visual for Power BI provides a D3.js skeleton visual that everybody can use to create custom visuals with D3.js. Either the visual can be created from scratch or an existing D3.js visual can be used via a seamless 'lift-and-shift' procedure.
Sponsors
Do you like my free community extensions? Please consider supporting me so I can reserve more time in keeping them running and adding more features.
Feedback
If you have any comment related to the documentation, like corrections, unclear features or missing documentation, feel free to leave feedback below via GitHub. Or correct it yourself and submit a PR; see CONTRIBUTING.md for more details. GitHub account required.